
Google Analytics is an extremely powerful tool and an online marketer’s best friend. It provides a suite of features that let you collect valuable data about your website’s traffic. Learning how to use Google Analytics is an absolute must for online marketers. As well as website developers and people who run their own websites. While Google Analytics is not the only tool that you have at your disposal, it is certainly worth using.
One should keep in mind that a tool can only be as good as the hand that holds it. Regardless of what kind of analytics software you have, it can only do so much for you. Google Analytics seems quite simple on the surface. However, if you dig a bit deeper you will see there is a lot that can be achieved with this software.
It all comes down to how well you are using your analytics tool. Sticking to the basics such as site traffic and insights on your ROI will only reveal a tiny bit of the picture. You need to start focusing on more important elements that will tell you so much more about your website traffic.
When used properly, Google Analytics can help you determine:
- How your website traffic interacts with your website. More importantly, how they go through the various funnels on your website.
- Incredibly detailed data on your website traffic’s demographics, their behaviour patterns and more. Once you understand their behaviour, you can begin planning ahead of them. This lets you market to them more effectively and greatly increase the chances of converting your visitors.
- Trends in your website’s traffic, through what channels people access your website and much more.
Google Analytics can gather information that effectively lets you see into your visitor’s mind. You can figure out what they like on your website and what they dislike. What parts of your website are easy to interact with and what parts aren’t. This kind of information acts as valuable marketing data and feedback for your website. It helps you formulate effective marketing strategies. It also lets you fine tune your website to make it as appealing for your visitors as possible.
We are going to be focusing on some of the more advanced techniques that you can use with this service. However, before we delve into the more obscure features of Google Analytics, let’s skim through the basics first.
Table of Contents
The Basics of Google Analytics
The basic features of Google Analytics are all found on its surface. These are what most people use when they carry out website analysis. Being basic doesn’t mean that these features aren’t useful. They can make data analysis quick and easy.
Data Segmentation
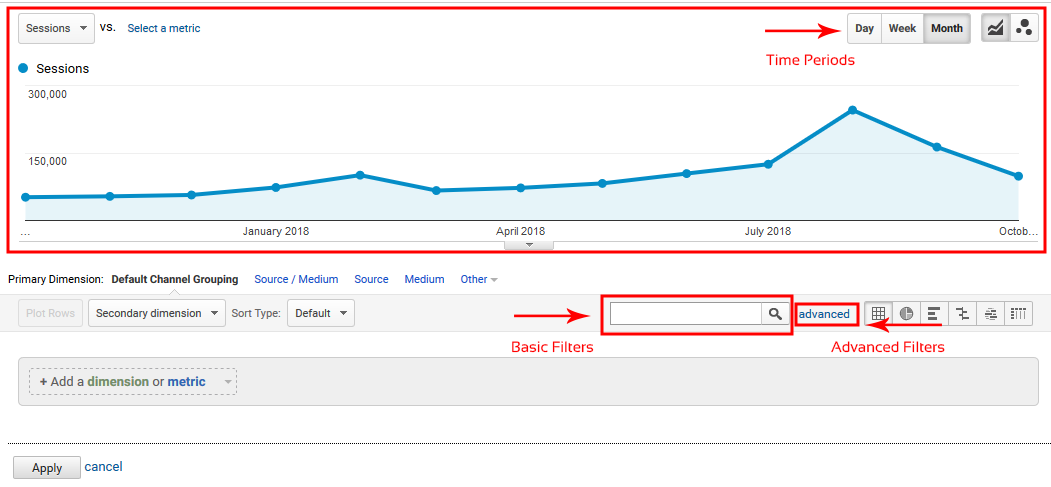
You can segment your data based on time periods. This lets you identify trends in traffic flow and also carry out comparisons of your website’s performance. When segmenting data according to time periods, you should always go for monthly divisions. Segmenting on an yearly basis can make it hard to identify various kinds of abnormal activity.
You can further refine your data by applying table filters. There are basic table filters that filter data based on your primary dimensions. For more precise filtering, you can apply advanced filters that let you set various conditions.
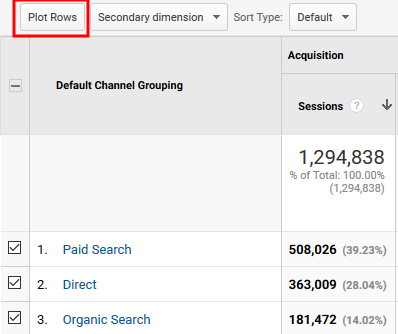
An important aspect of data analysis is being able to understand what your data means. Google Analytics has a handy plot rows option that lets you select certain dimensions. You can select them and then plot them on a graph to visualize the data better. This feature is useful if you want to present a website’s data to a client.
Reports
Google Analytics’ reports are what you are going to be viewing most of the time. The software has a ton of reports that provide you with insights on all kinds of metric dimensions. Some of these reports are quite easy to access while other require a bit more effort. We are going to be focusing on the more obscure reports that provide incredibly valuable information. Being able to make the most out of these reports can take your website analysis to the next level.
There is a lot that Google Analytics reports can do. You can customize your reports with Google Analytics’ data segmentation methods. This lets you explore metrics that are qualitative. A qualitative analysis results in better decisions based on your findings.
Let’s take a look at a few methods that can help you gather data from your website. Which can then be used to optimize your website’s user experience.
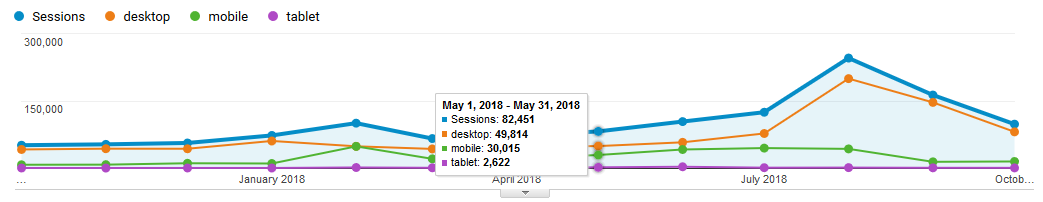
#1 Identify Mobile And Desktop Traffic
The number of people who access websites through their smartphones has exceeded desktop users by quite a margin. This means that providing an exemplary tablet/mobile experience is an important factor. Google Analytics has an option for generating a report for this purpose. Navigate to the “Audience” section in Google Analytics. From here, you can view your website’s desktop to mobile conversion rates. This report can provide you detailed information such as how much time a visitor spent on your webpage. The longer they stay, the better.
You also get to view your “Conversion Rate Number” for every device. Higher conversion rate numbers equal to better user experiences. Having this kind of information on hand lets you figure out what aspect of your website needs tweaking and revision. An enjoyable user experience across all devices will help you increase your customer conversion rate.
#2 Work on Improving Your Website’s Paths
Most people believe that the homepage is the most crucial section of a website. It is a website’s front door and therefore it should act as a website’s central hub. While this does make sense, this also makes your homepage crowded and confusing. You shouldn’t bank on generating all of your website’s traffic through your homepage. Instead, you should develop additional paths through blogs and social media pages.
In order to create better “intuitive” paths for your website’s traffic, you need data on your visitor’s navigation behaviour first. You can find this kind of data by going to “Behaviour Flow” in Google Analytics’ “Behaviour” section. Once you’re there, apply a “Source/Medium” filter on your traffic to determine your traffic’s origin. You will want to look for traffic being generated through “Google/Organic”.
From here, you will be able to identify all your landing pages under “Starting Pages”. These are the pages that visitors land on when they access your website through inbound channels. The Starting Pages section leads to the “Next Interaction” section. This lists all the place where visitors navigate to after arriving on the landing page.
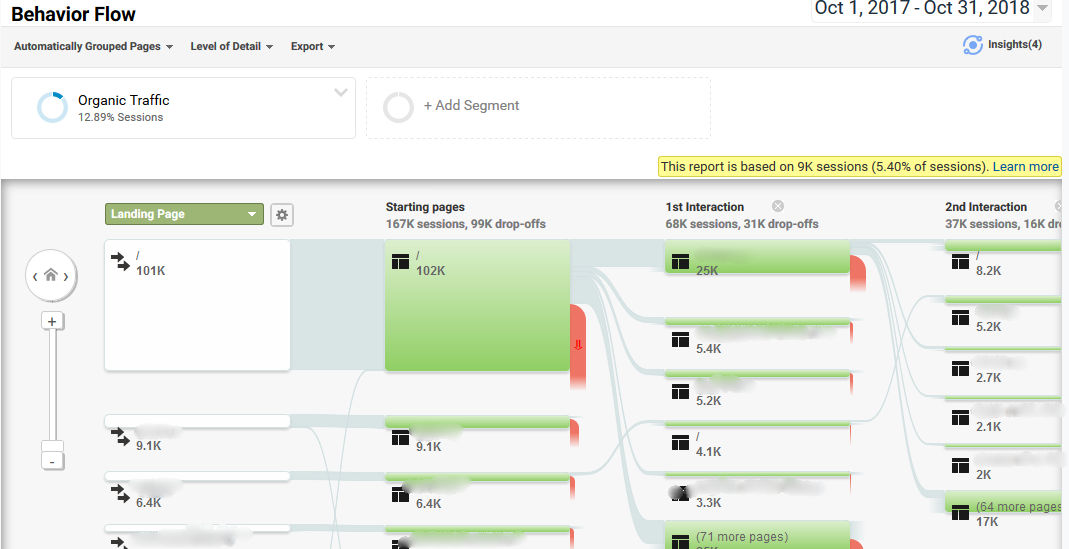
This analysis will reveal that your homepage is responsible for generating roughly 30% of your traffic. This isn’t because you have a badly designed homepage. Rather, the homepage gets shadowed by more intuitive paths. These paths originate from blogs, through SEO work, and other channels.
Once you identify your website’s “intuitive paths”, you can begin exploiting them. Work on improving your landing pages and figure out how you can attract more traffic through these paths. Doing so can help you increase your conversion rates, drive sales, and make sure that more visitors travel down your funnels.
#3 Improve on Webpages With High Potential
Focusing on your best pages is a good tactic. A great tactic is to maintain your best pages while also identifying your “underdog” pages. Identify these pages with potential and then work on maximizing their potential. Doing so will increase your number of pages that make it to first page results.
Identifying these pages is relatively simple. Navigate to “Acquisition” and then “Search Console”. From here, go to “Queries Report”. You can view SEO information that will tell you which search phrases generate traffic for your webpages. Once you are here, start looking for all your webpages that make it to the second page of Google’s search results. These are all the pages that have the potential to generate traffic for you. However, since they don’t make it to the first page, they aren’t seen by most people.
You can view all of your second page results in the queries report by applying an advanced filter. Google Analytics’ advanced filters can be handy for zeroing in on useful data. A simple “greater than 11” advanced filter will gather all of your webpages that are ranked 11th or higher by SERP. Now, further refine your results by looking for pages that have higher rankings on the second page.
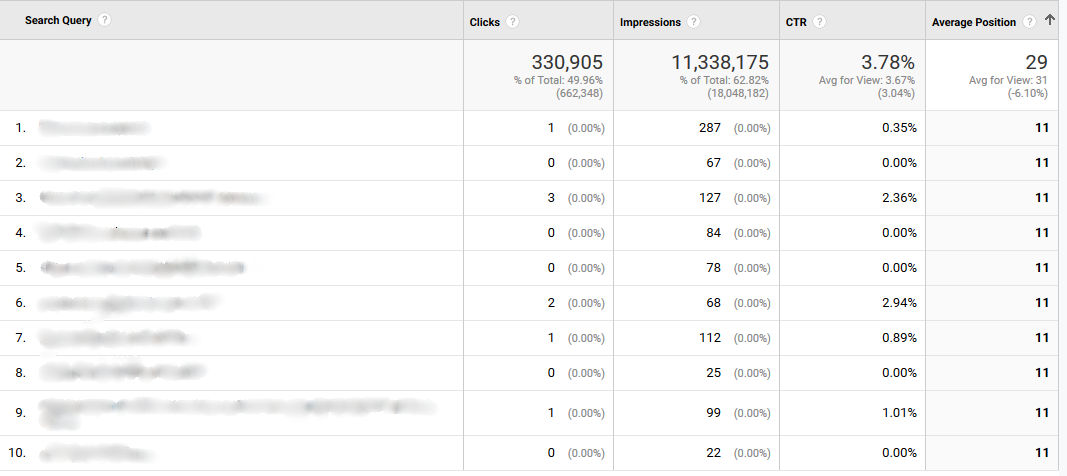
After doing all of this, you will know which pages you should work on. Improve their design and make them useful by improving their content. Doing so can improve their performance by a margin and help them cross that 10th position mark on SERP.
#4 Plugging Potential Visitor Leaks
They say that every visitor that lands on your website is a potential customer. However, in order to convert them successfully, you need to keep them on your website. Long enough to make them go through your funnel. Many websites have trouble with bounce rates; visitors land on them but don’t stick around. This usually happens because of the page that they land on. Something on that page makes visitors want to leave. Be it a design flaw or bad content, you need to identify these pages and improve them. If that is not an option, then prevent them from becoming landing pages.
To identify these pages, go to “Behaviour” and from there, navigate to “Site Content” and then “All Pages”. Once you are here, change the Primary Dimension to “Landing Page” under Acquisition tab.
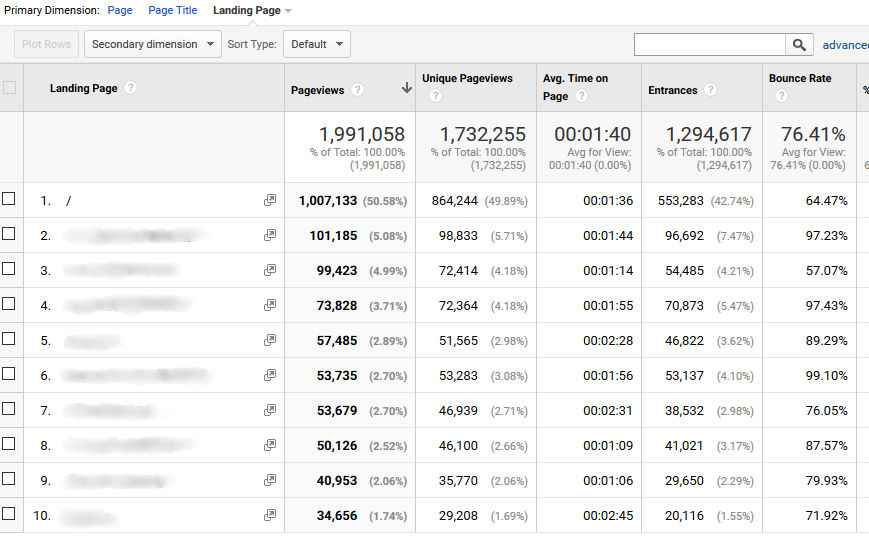
Once you know which pages are responsible for your high bounce rates, you can begin working on them. In situations like these, you can always involve your visitors in the improvement process. Conduct a live survey or contact them through Live Chat. This can provide you with qualitative data about what is wrong with the said pages.
#5 Enhance Internal Linking to Keep Visitors Around For Longer
Having a visitor land on your page isn’t where your site traffic management ends. You also need to make sure that every visitor stays on your website for as long as possible. The purpose behind this is to funnel your website’s traffic better. You can only reach this step if you have followed everything mentioned above. This is because keeping a visitor around requires your website to be engaging and easy to use. Most of all, it shouldn’t have any “leaks” that might take your visitor away from you.
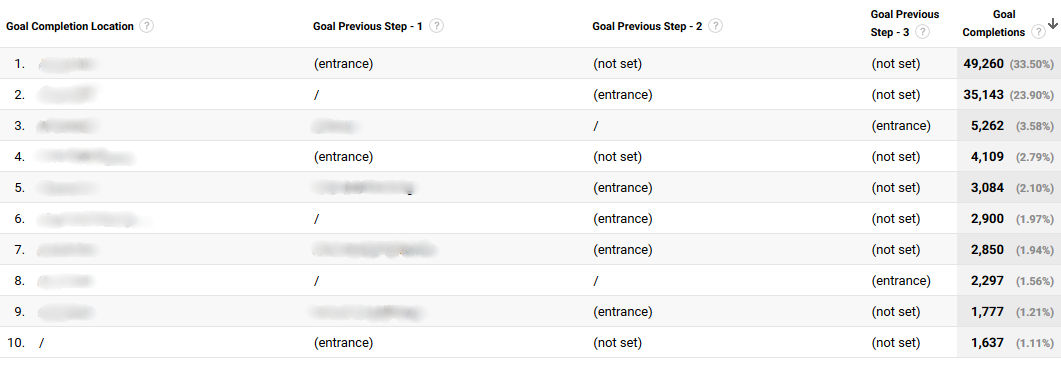
In Google Analytics’ “Conversions” tab, under “Goals”, you can find the “Reverse Goal Path” section. Navigate to it and select what goal you want to analyse. This lets you see the last page that a visitor landed on before they were able to reach the selected goal. All of these pages are known as your highest converting pages. Upon identifying your highest converting pages, you can begin focusing on funnelling your traffic through them.
#6 Setting Up Intelligence Events
Taking numbers and churning them into reports isn’t the only thing that Google Analytics can do. This software can also be used to set up alerts known as intelligence events. These events let you tailor them a lot. They tell Google Analytics to send you an alert whenever a specified event takes place. For example. If your website’s traffic rises by a specified amount (such as 300%), Google Analytics will inform you in real time.
This is a pretty handy feature. It lets you stay on top of things at all times without having to monitor your website’s activity. To start the set up, you need to click on “Customization” in the left pane, and then click on “Custom Alerts”. Once you are on the Custom Alerts page, click on “Manage Custom Alerts”, this will take you to a section where you can create, delete, and manage your custom alerts.

Overall, Google Analytics is a very capable tool. However, it doesn’t get the credit that it deserves. This is because most people aren’t able to realize its true potential. With a bit of snooping around and guidance, you can start gaining incredibly in-depth data on your website. The kind of data that companies would pay huge sums of money for.
In digital marketing, being able to gather useful data is easy. Being able to derive relevant information out of it is what sets you apart.